

In a study of nearly 2,850 elective surgical cases at Stanford University School of Medicine, researchers found that 26% of cases had a negative contribution margin per hour of OR time. The hospital was performing them, staffing them, and scheduling them into prime-time blocks. They were losing money on every hour.
That study, published in Anesthesia & Analgesia, reached a conclusion that still surprises finance teams: to improve OR profitability, managers should increase the hours of lucrative cases, not simply encourage surgeons to do more cases.
Most OR financial reviews still start and end with volume: which service lines are growing, which surgeons are bringing cases, how many procedures ran last quarter. Volume matters. But it's a poor proxy for profitability, because it ignores supply cost variation, case duration relative to reimbursement, and the cost of the OR time itself. Contribution margin analysis fixes that.
What is contribution margin in the OR?
OR contribution margin is net revenue for a surgical case minus the variable direct costs of performing that case. It tells you how much each case contributes toward covering the hospital's fixed costs (buildings, equipment, administrative overhead) and generating margin.
The basic formula:
Contribution margin = Net revenue − Variable direct costs
Variable direct costs typically include implants and supplies, drugs, and the labor that flexes with case volume and duration. Fixed costs, such as depreciation on the OR suite and salaried administrative staff, are excluded.
In perioperative services, contribution margin per case is a useful starting point, but the more important number is contribution margin per OR hour. OR time is the constrained resource. A service line that generates a high margin per case but consumes four hours of OR time may contribute less per hour than a shorter, lower-margin procedure. When OR capacity is the limiting factor, margin per hour is the number that should drive block allocation and growth decisions.
Why volume is misleading
Reimbursement is mostly fixed. OR time isn't.
For most procedures, payment is set by the procedure or diagnosis group, not by how long the case takes. The cost of OR time, meanwhile, keeps climbing. A 2026 JAMA Surgery study of 278 California hospitals found the average cost of an OR minute reached $57.71 in fiscal year 2022, up 54% since 2014. That's a growth rate of about 5.2% per year. Wages and benefits accounted for roughly two-thirds of direct costs.
When payment is fixed and time is variable, a case that runs 40 minutes longer than its peers erodes margin even if its revenue looks identical on a volume report.
Supply costs vary by surgeon, often without changing outcomes.
A study from the University of California, San Francisco, published in Urology Practice, examined 211 laparoscopic nephrectomies performed by six surgeons. Median supply cost per case ranged from $1,642 to $4,524 across surgeons, a 2.8-fold difference, even after adjusting for patient factors and case complexity. Higher supply costs didn't predict any difference in length of stay. The largest drivers were energy devices and hemostatic agents, choices that live on the preference card.
Hospital costs are rising faster than prices.
The American Hospital Association's most recent Cost of Caring report found hospital expenses rose 7.5% in 2025, while prices rose 3.3%. Supply expenses rose 9.9%. The AHA also found that 56.1% of hospital costs sit in service lines where reimbursement falls short of the cost to deliver care. A volume-only view of the OR can't show which of your surgical service lines are in that category.
How to calculate OR contribution margin by service line: a five-step framework
Step 1: Define net revenue at the case level
Use actual expected or collected net revenue by case, not gross charges. A 2026 JAMA Surgery analysis found that average charges per OR minute ($295) bore little resemblance to average revenue per OR minute, and the authors stressed that charges, costs, and revenue are not interchangeable. Payer mix matters. The same procedure can carry very different net revenue depending on whether it's commercial, Medicare, or Medicaid.
Step 2: Capture variable direct costs
Pull implant and supply costs from the case record (ideally tied to the preference card and actual usage), drug costs, and variable labor. Variable labor is where many analyses get stuck. Decide up front whether you're treating nursing and anesthesia time as variable (it flexes with OR minutes and overtime) or fixed (salaried staff who are paid regardless). Be consistent, and document the choice.
Step 3: Choose the right denominator
Calculate contribution margin per case and per OR hour. For OR hours, include turnover time attributable to the case, not just incision-to-close. A procedure with long setup or room cleanup consumes more capacity than its surgical time suggests.
Step 4: Segment the results
Cut the data by service line, procedure, surgeon, and payer. Service line averages are useful for strategy. Surgeon-level and procedure-level views are where the actionable variation tends to show up.
Step 5: Set minimum volumes and risk-adjust
Small samples produce misleading margins. Set a minimum case count before drawing conclusions about any surgeon or procedure, and adjust for case complexity and patient acuity where your data allows. The goal is a fair comparison, not a ranking that falls apart under scrutiny.
A working example: when the high-volume service line isn't the best performer
The numbers below are hypothetical and simplified for illustration.
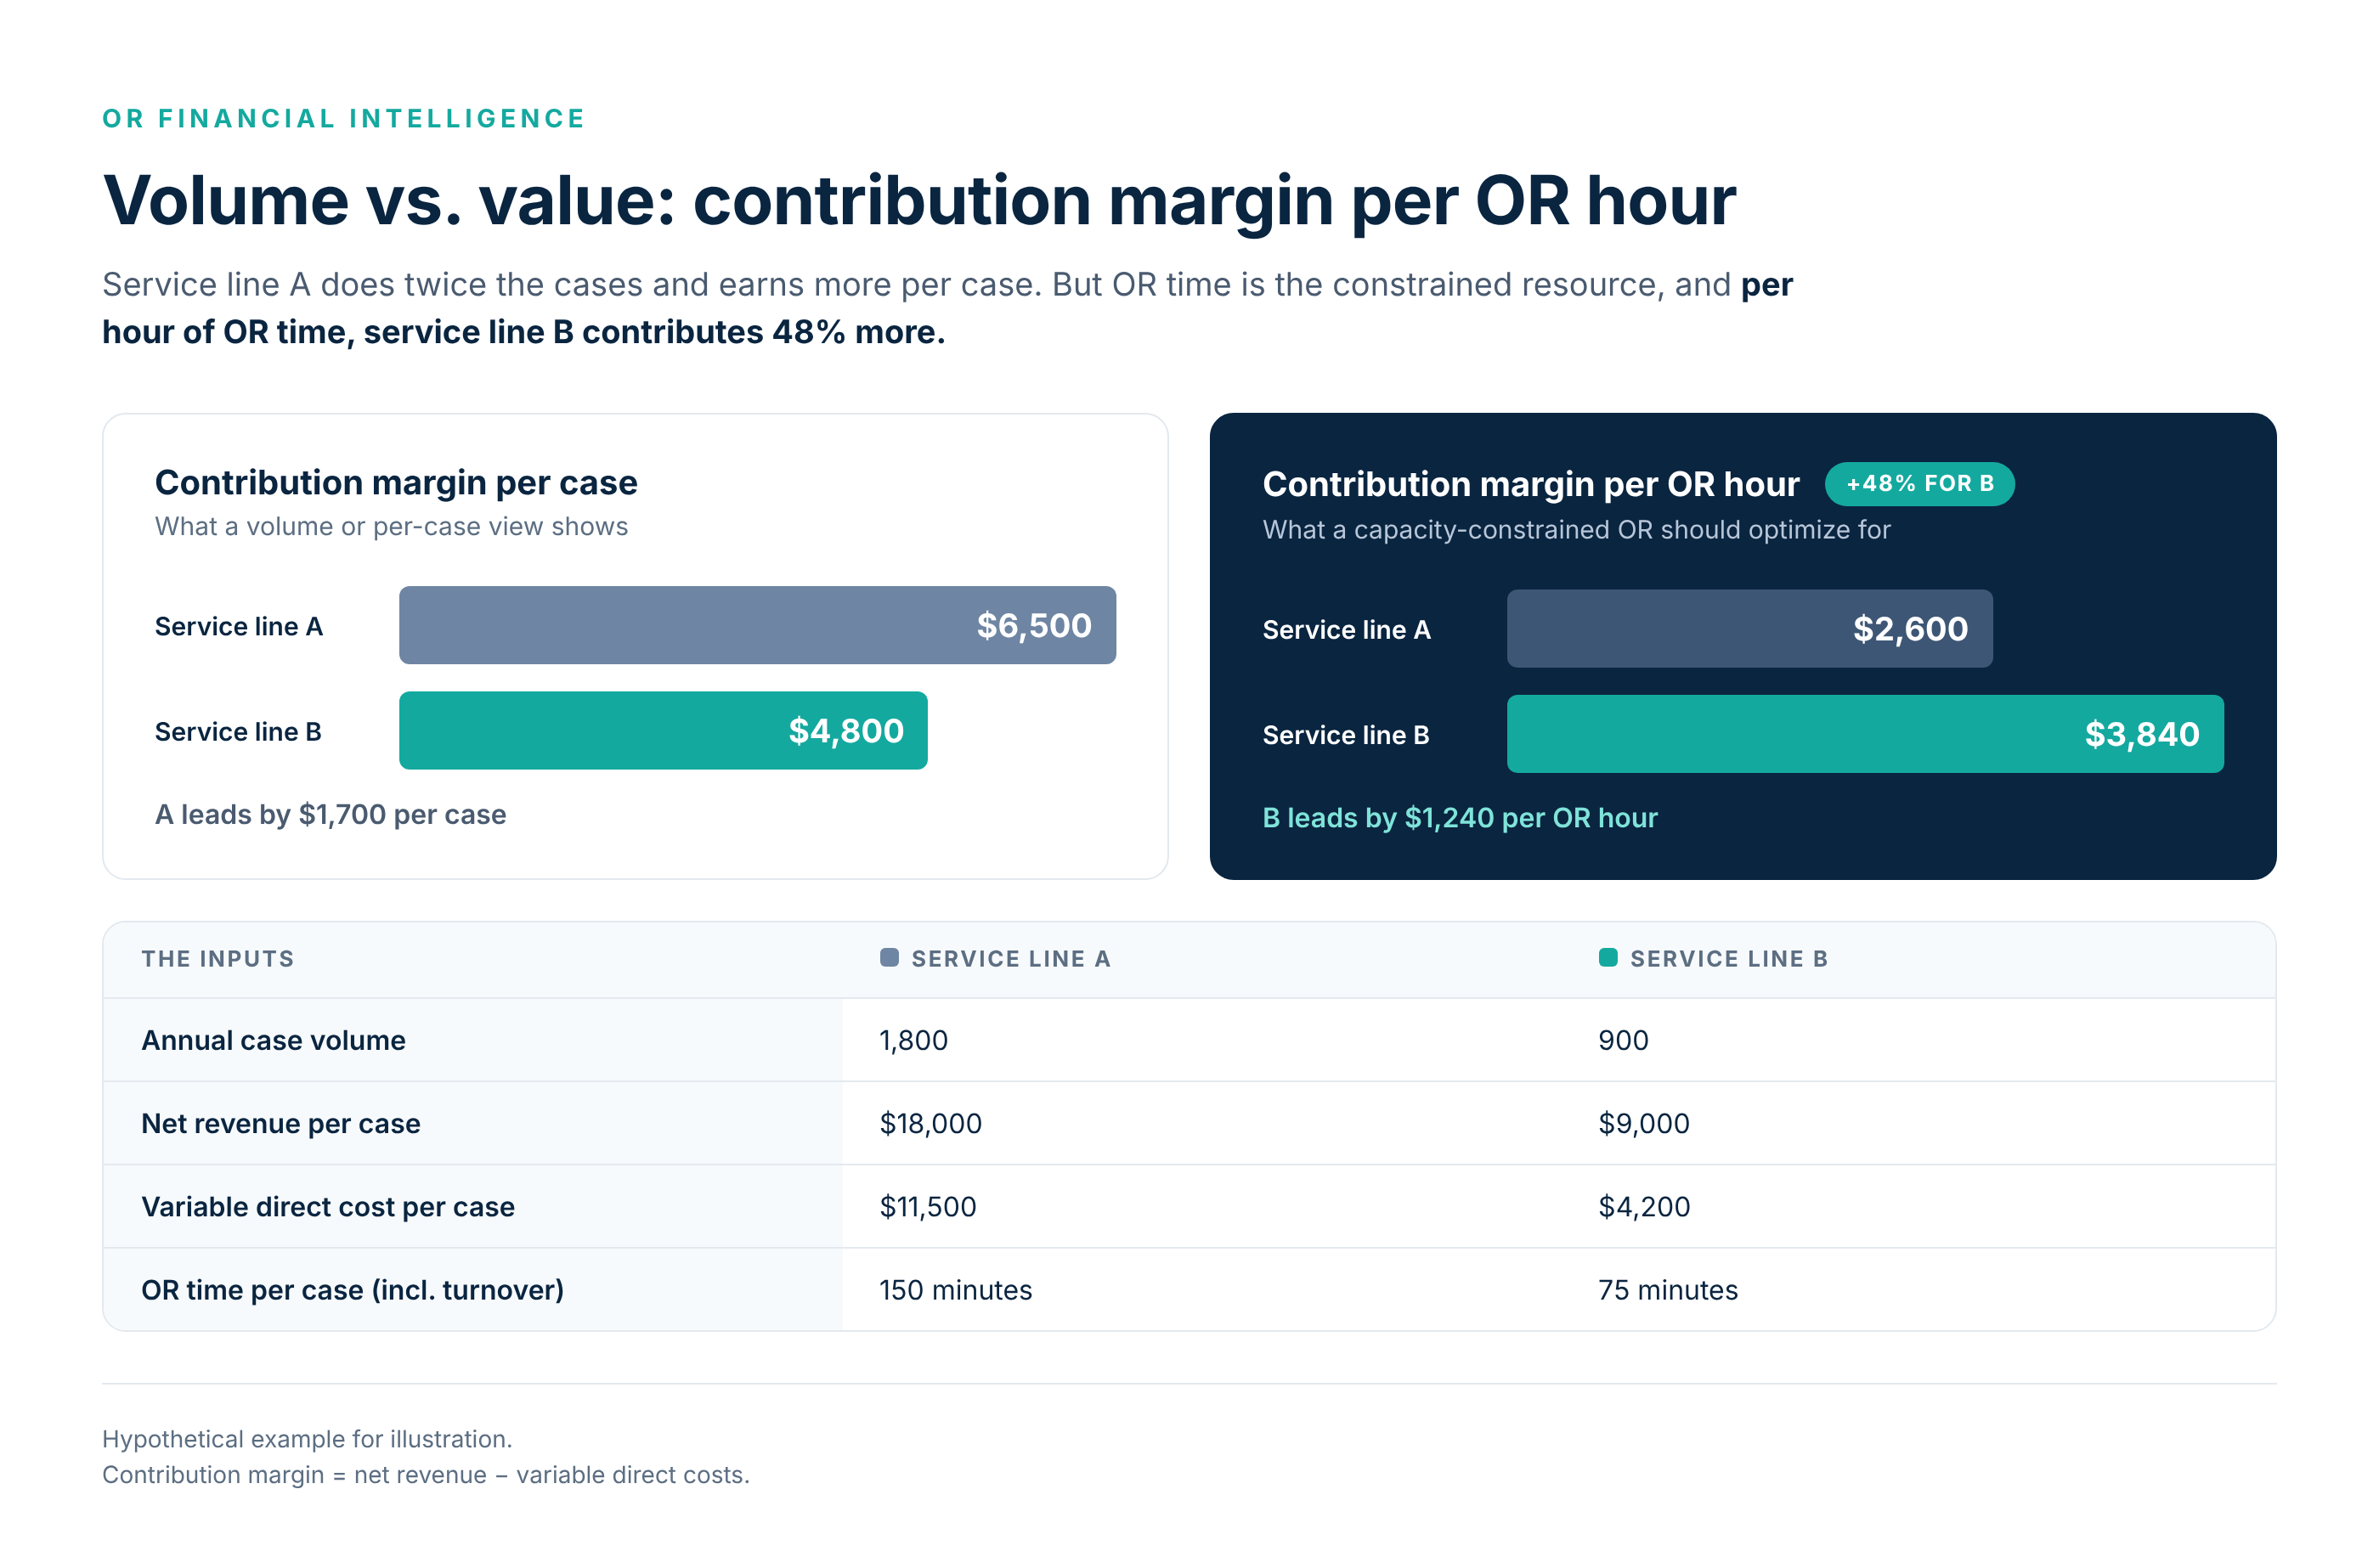
On a volume or per-case view, service line A looks like the stronger performer. It does twice the cases and contributes $1,700 more per case. But per hour of OR time, service line B contributes about 48% more.
If the OR is capacity-constrained and service line B has unmet demand, shifting a block from A to B could increase total contribution margin without adding a single room. That's a counterintuitive finding, and it's exactly the kind of insight a volume report can't surface. It doesn't mean service line A should shrink. It may mean the conversation should shift to supply standardization, case duration accuracy, or turnover time in service line A, the levers that raise its margin per hour.
Where OR contribution margin analysis goes wrong
Bad timestamps distort the denominator. Contribution margin per OR hour is only as accurate as the time data underneath it. A 2026 University of Wisconsin study in the Journal of Medical Systems found a 17% error rate in manually documented intraoperative timestamps, with error rates climbing above 25% when entries were delayed. If case times are wrong, margin per hour is wrong.
Allocated costs creep in. Including fixed overhead allocations turns contribution margin into a fully loaded cost analysis, which answers a different question. Keep the two separate.
Charges are used as revenue. As the JAMA Surgery data shows, charges and actual revenue can differ by a factor of four or more.
The analysis stops at the service line. The largest improvement opportunities usually sit at the procedure and surgeon level, where preference card and duration variation live.
How to present contribution margin data to surgeons
Contribution margin data can build alignment or create resentment, depending on how it's shared. A few principles help:
- Lead with the purpose. Frame the analysis around protecting OR capacity and funding growth, not cutting surgeons' time.
- Show peers, not rankings. Blinded peer comparisons for the same procedure are more productive than league tables.
- Separate what the surgeon controls from what they don't. Payer mix and reimbursement aren't in a surgeon's hands. Preference card choices and case duration often are.
- Pair cost data with outcome data. The UCSF findings, where higher supply costs didn't correspond to shorter stays, show that cost variation and quality variation are separate questions. Make that explicit.
- Bring a lever, not just a number. Preference card standardization, better case duration estimates, and faster turnover give surgeons something to act on.
What OR operational platforms need to do to support this
Contribution margin analysis usually breaks down because operational and financial data live in different systems. Scheduling and timestamps sit in the EHR's perioperative module. Supply costs sit in materials management. Revenue sits in the revenue cycle system. Labor sits in workforce management.
To support margin analysis, an OR intelligence platform should connect case-level timestamps, block allocation, preference card and supply data, and case duration predictions, so finance and surgical services leaders are looking at the same per-case and per-hour view. It should also flag unreliable time data rather than silently averaging it in.
Leap Rail's Financial Intelligence capabilities are designed for exactly this: connecting scheduling, case, preference card, and supply data so perioperative and finance leaders can see contribution margin by service line, procedure, and surgeon, alongside the operational levers that move it.
Want to see what contribution margin by service line looks like in the Leap Rail platform? Request a demo with our team.